Choose the chart type. Enter labels and numeric values.
What this tool does
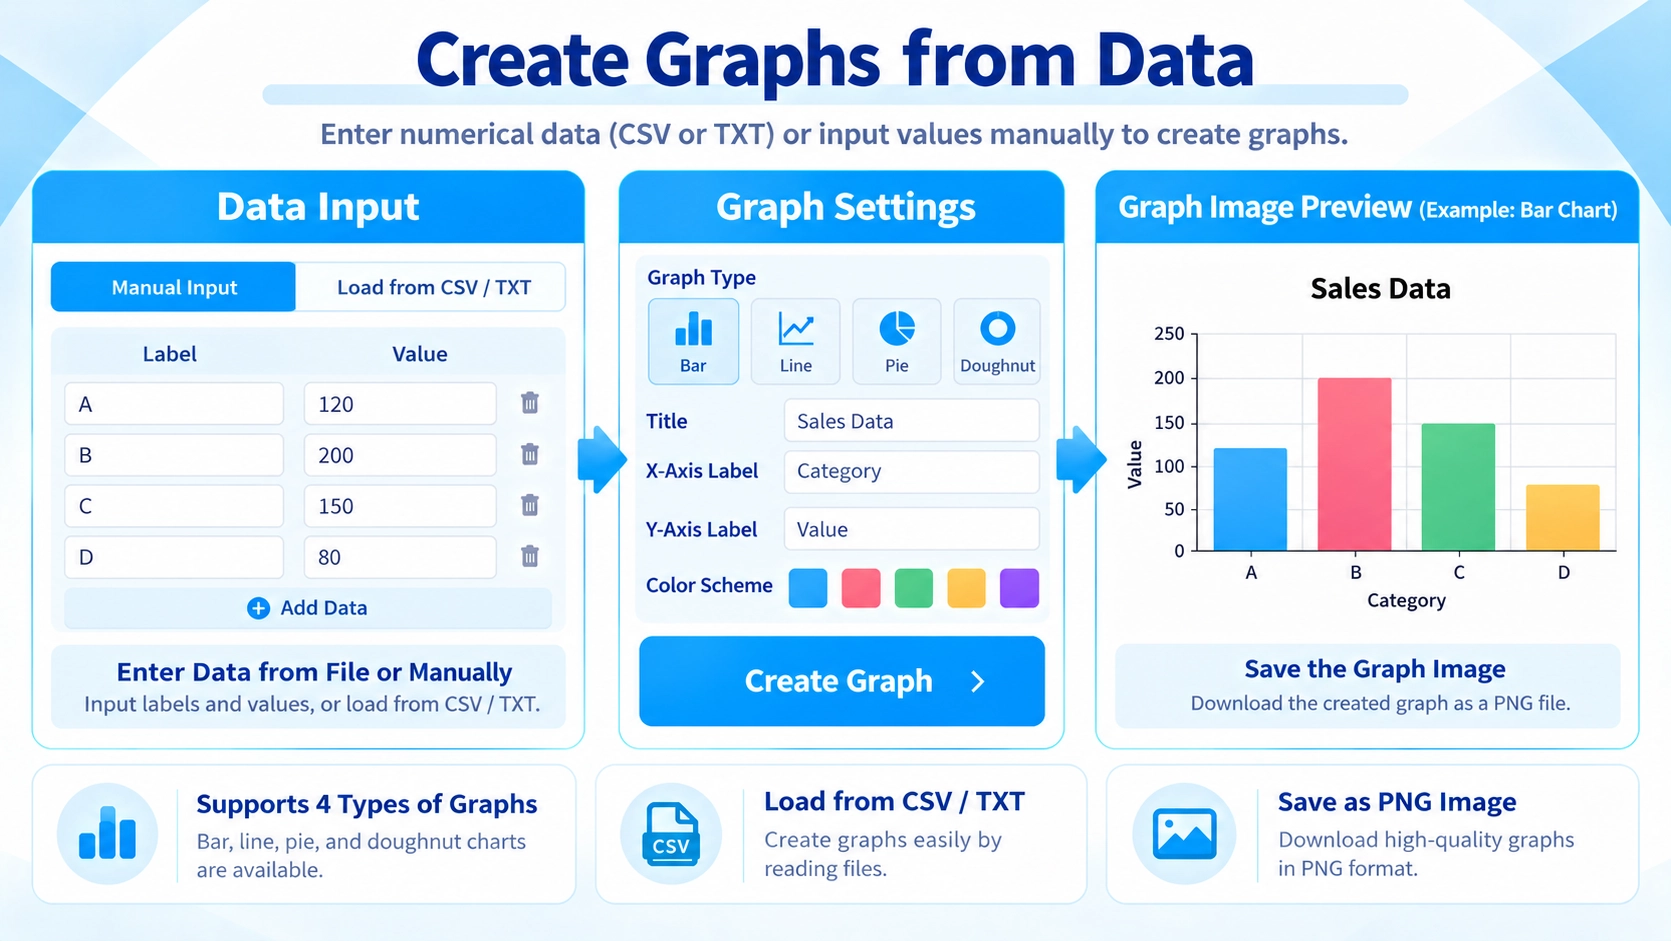
Create bar, line, and pie charts from entered data in your browser, and save the chart as a PNG image.
How to use it
- Choose the chart type.
- Enter labels and numeric values.
- Adjust the display and preview the chart.
- Download the chart as a PNG image.
Supported input and notes
Keep the input structure consistent so the chart renders correctly. Check labels, units, and numeric values before exporting.
When it is useful
Useful for reports, blog posts, slides, and simple visual summaries.
Chart Types
You can create bar, line, pie, and doughnut charts. Bar charts are useful for comparing items, line charts for changes over a sequence, and pie or doughnut charts for showing proportions.
Labels and Values
The label list and the value list are read line by line. If the counts do not match, or a value cannot be read as a number, the chart cannot be generated.
CSV and TXT Import
When a CSV or TXT file is loaded, the first column is used as labels and the second column as values. If the first row looks like a header, it is excluded from the plotted data and used for axis labels.
Number Parsing
The parser removes commas, full-width numerals, percent signs, and currency symbols, so values such as “1,200”, “1200”, “$1,200”, and “€1,200” can still be interpreted as numbers. A value such as “25%” is treated as the number 25, not 0.25.
Colors and Text Size
You can use main and secondary colors, add custom colors, and adjust the text size for the title, axes or legend, and numeric labels.
Preview Zoom vs Export Size
The exported image size is set with width and height controls from 600–1600px wide and 400–1000px high. The preview zoom only changes how the chart is shown on screen.
PNG Export
The finished chart is saved as a PNG image. Direct export to JPG or SVG is not available.
FAQ
Can I create a multi-series chart?
No. The current tool uses one label list and one value list, so it creates a single-series chart.
How many CSV columns are used?
Normally the first column is used for labels and the second column for values.
Does changing the preview zoom change the saved image size?
No. The export size is controlled by the width and height settings.
Which file format is used for export?
PNG only.